Kubernetes Dashboard
One of the great things about Grafana is its extensive library of contributed dashboards, which can be easily imported into your Grafana setup simply by copying the dashboard ID from the library. There are plenty to chose from for Kubernetes monitoring, but we opted for this excellent set.
Getting the Dashboards Working
Part of the fun(!) of this part of the project was discovering that many of the provided Grafana Kubernetes dashboards don't work out of the box with the current version of Kubernetes, as many of the metrics have been deprecated since the dashboards were published.
This is where the web interface for Prometheus is your friend. We spent a lot of time looking up the metrics that weren't working in the JSON for the dashboards (obtained from Dashboard Settings > JSON Model in Grafana), and finding the correct names and attributes in what Prometheus was providing, using the Search feature from the Prometheus Graph menu.
Dashboards
Note
Our installation of metrics and monitoring being fairly recent (early February 2023), we don't have a full month of data yet, but we have provided examples of what will be posted at the end of the month.
Overview - February 2023

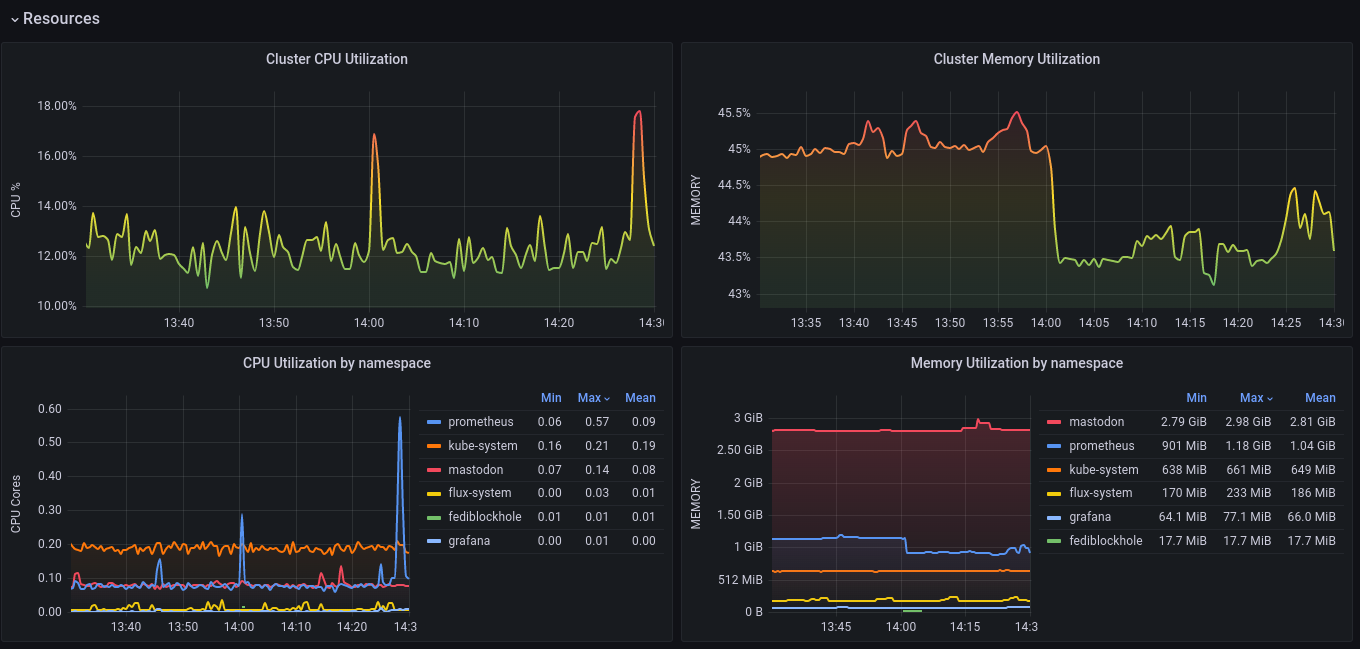
Resources - February 2023
Network - February 2023
